Technology
Study Shows Link Between Flickr Posting and Severity of Hurricane Sandy
Was there a link between the volume of social media pictures of Hurricane Sandy and the atmospheric pressure in New Jersey? A new study by British researchers says yes, that number of pictures posted on Flickr last year had a correlation.
Nov. 05, 2013

Was there a link between the volume of social media pictures of Hurricane Sandy and the atmospheric pressure in New Jersey? A new study by British researchers says yes, that number of pictures posted on Flickr last year had a correlation.
Dubbed a Super Storm, Sandy became the second-costliest hurricane to hit the US, hitting 24 states in October 2012, most notably New Jersey and New York.
In 2012, a total of 32 million photos were posted on image sharing website Flickr. Researchers counted the number of pictures with tags for ‘Hurricane Sandy’, ‘hurricane’ or ‘sandy’ between October 20 and November 20, 2012.
Tobias Preis, Associate Professor of Behavioural Science and Finance, and Suzy Moat, Assistant Professor of Behavioural Science, both of the Warwick Business School, led the study, which found a strong link to atmospheric pressure dropping in New Jersey. There results even show that the peak in posting the pictures was at the same hour that Hurricane Sandy made landfall in New Jersey.
In “Quantifying the Digital Traces of Hurricane Sandy on Flickr,” which was published in Scientific Reports on Tuesday November 5, Preis and Moat, along with Steven Bishop and Philip Treleaven, of UCL, and H. Eugene Stanley, of Boston University, suggest that using such online indicators could help governments measure the impact of disasters.
Preis and Moat’s work has previously uncovered a range of intriguing links between what people look for online and their behaviour in the real world. Recent results revealed that changes in how frequently people searched for financial information on Google and Wikipedia could be interpreted as early signs of stock market moves, and that internet users in countries with a higher per capita GDP search for more information about the future.
“Our steadily increasing use of digital technology is opening up new and fruitful ways to document and follow human actions,” said Dr Preis. “Building on our recent work, we asked whether data from photos uploaded to Flickr could have been used to measure the impact of Hurricane Sandy.
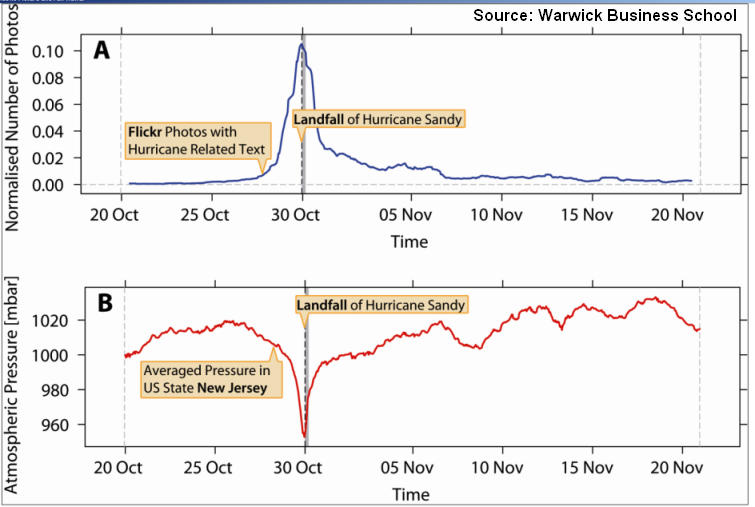
“Our new results show that the greatest number of photos taken with Flickr titles, descriptions or tags including the words ‘hurricane’, ‘sandy’ or ‘Hurricane Sandy’ were taken in exactly the hour which Hurricane Sandy made landfall in New Jersey.
“Examination of the number of Hurricane Sandy related photos taken before and after landfall reveals a striking correlation with environmental measurements of the development of the hurricane.”
Dr Moat added: “As the severity of a hurricane in a given area increases, atmospheric pressure drops. We found that as atmospheric pressure in New Jersey fell the number of photos taken rose and as atmospheric pressure climbed again the number of photos taken fell. (See graphs attached)
“Plotting the data revealed that the number of photos taken increased continuously while ‘Sandy’ was moving towards the coast of the US. This study would suggest that in cases where no external sensors are available, it may be possible to use the number of Flickr photos relating to a topic to gauge the current level of this category of problems.
“Flickr can be considered as a system of large scale real-time sensors, documenting collective human attention. Increases in Flickr photo counts with particular labels may reveal notable increases in attention to a particular issue, which in some cases may merit further investigation for policy makers.
“Appropriate leverage of such online indicators of large disasters could be useful to policy makers and others charged with emergency crisis management: in particular if no secondary environmental measures are available.”
